


4. Racist Arguments Don’t Work
4. Racist Arguments Don’t Work
Who goes to school in Chicago today, how it got that way, and why "culture" can't explain the Achievement Gap.

Disclaimer: Chicago Focused, but About Everywhere
I’ve lived nearly half my life in the Chicago Metropolitan Area and spent my entire career in education in the City of Chicago, so I will be focusing most of my analyses and observations about education on what I consider home.
However, the truth is that in much of what I unpack, you could easily replace “Chicago” with the name of most other US urban centers and the points I make would be equally valid.
So, if you are in, near, or know Chicago, much of this will feel familiar.
And if you are further away from and less familiar with my city, I hope you will see the universal truths that apply to every city in this country when we talk about race and educating children of color.
Acknowledging Race
There is broad agreement that south and west side communities in Chicago have experienced disinvestment over decades and have faced years of discriminatory policies and practices. As a result, they have watched their education infrastructure struggle significantly.
The underlying meaning of “south” and “west” in this case is coded terminology for many Chicagoans, simply safe words for the obvious: places with predominantly Black and Latinx/a/o families living below the poverty line.
It is essential that we refer to south and west side communities as what they are in clear terms - Black/Latinx/a/o and poor.
By centering on race we can start cataloging the legacy of systems, policies, and practices that have singled out these communities based solely on race, isolated them, ensured they have remained segregated, and systematically manufactured the challenges the families living there face today.
Who Goes to School and Where
It is not a mistake that I am starting our consideration of the role of race in education policy by talking about who is in Chicago’s schools and how that population has shifted over time. Race in Chicago area schools is in some ways the only discussion worth having because it is the only discussion we are actually having, even when we believe we are talking about something else.
Unpacking the realities of race-driven policy for Black and Latinx/a/o populations is critical, as it is through their experience that we can begin to unravel the origin and legacy of the Achievement Gap.
We can begin by noting that Chicago’s public school district today is predominantly Black and Latinx/a/o and poor. More than 3 of 4 children are designated by the Federal Government as economically disadvantaged, where those rates index higher for Black and Latinx/a/o CPS students. The racial composition has stayed consistent in the past few years[1].
Beginnings
By 1871, the year of the great Chicago fire, the City had a free public school system where by law all children were allowed to attend, regardless of race. By 1874, legal protections specifically allowing children of color to attend public school were made even more explicit. CPS was a public school system fully open to any child, regardless of race.
The only Chicago residents at the turn of the century who would be deemed Non-White today and who had significant numbers were Black Chicagoans (Negroes). Blacks numbered just over 25,000 and represented under 2% of all Chicagoans in 1898, a City that was still hovering around 500,000 residents. The vast majority of Chicago and the surrounding region would remain what we would call White today up until the early 1920s. Not a topic we will delve deeper into, but worth noting, is that a number of these “White” populations were not seen or treated as such during this time. This was especially true for poor White immigrant populations who had not yet been accepted into the privileged class of “White America” of that period. As I said, race is a social construct, but we digress.
It wasn’t until 1900-1910 that more than half of the school-age population began to go to school. And while Chicago’s public schools were open to children of any race, Chicago’s population was 98% White at that time and the school-aged population was more than 95% White.
Black Students in Chicago Public Schools
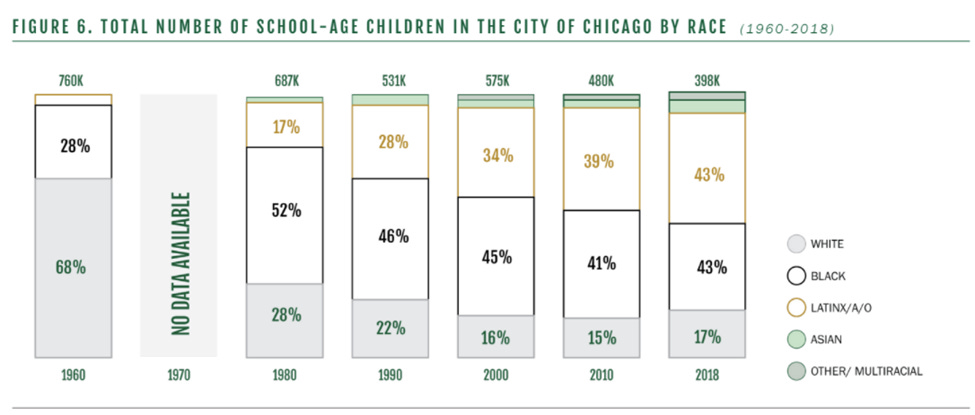
The population of Chicago would see a dramatic shift starting in the 1950s, when the Great Migration, the influx of Black people moving from the southern US to find work and better overall conditions for their families, would bring them to many northern industrial cities like Chicago.
The City of Chicago had more than 3 million people at its peak from 1930 to 1950 with the vast majority being White. This population of more than 3 million residents would hold until 1980, but by 1960, the influx of southern Blacks had begun to dramatically shift the complexion of Chicago.
The Black population exploded during the decades from the 50s through the 70s, as more than a million African Americans settled into the redlined communities Chicago permitted them to live in. At the same time, the city experienced a White flight that saw nearly 2 million people fleeing for the suburbs and beyond. Seemingly overnight, White neighborhoods emptied out and were replaced swath by swath by Blacks, like patches being torn from and replaced on a quilt.
Predictably, this dramatic change in the overall population was mirrored in Chicago schools, where, by the 1970s, White children were no longer the majority of students. In public schools, the impact was even more pronounced, as White families who did not flee Chicago often fled the public school system by seeking out parochial schools and other private options.
Today, only about 1 in 2 White children living in Chicago go to Chicago Public Schools (CPS), the lowest public school subscription rate for any racial category in the City[3]. As a result, a predominantly White CPS transitioned into a predominantly Black one.
Holding consistent with the quilt analogy this happened school by school. Many of the majority-White schools today are the few holdouts whose neighborhoods historically found ways to stave off Black people moving in.
The Black families that came to live in and go to school in Chicago were on average poorer and less well-educated than the White families who resided in the City. Black people were fleeing the ugly oppression of the South at that time and for many a northern city like Chicago meant their children would have access to an education system for the first time ever. This lack of generational wealth and education is critical to note for this population, as it is one of the roots of the Achievement Gap we see today for Black students in Chicago Public School as well as the broader Metropolitan Area.
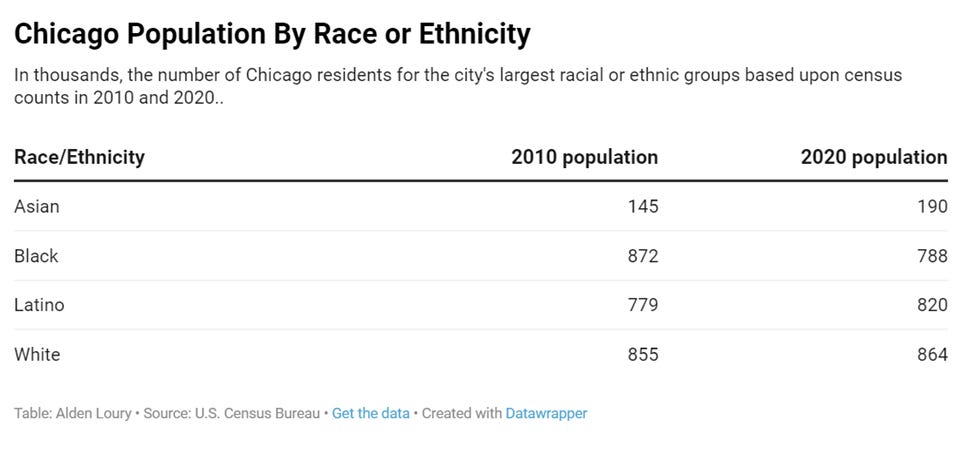
Black students were the largest population in CPS until the 2010-2011 school year when they were overtaken by Latinx/a/o students[4]. This shift was largely driven by a mass exodus of Black families out of Chicago and into the surrounding region or further away. A predominant driver for this out-migration has been Black families seeking a better quality of life and work opportunities. According to census data, Chicago has seen 260,000 Black people leave over the two decades from 2000 to 2020[5].
This has dramatically impacted Black student enrollment in CPS where 85% of Black children in Chicago enroll in the public school system[6]. Today, Black students make up 36% of CPS, second only to Latinx/a/o students[7].
Latinx/a/o Students in Chicago Public Schools
Latinx/a/o people have been the primary driver for population growth in the Chicago Metropolitan Area for the past several decades and similar to the national projections are anticipated to be at least 30% of the region’s population by the year 2050[8]. Four out of five Latinx/a/o people living in the Chicago region are of Mexican origin with the next largest subgroup being Puerto Rican[9]. Mexican-born immigration accelerated in the 1960s, which is paralleled by population trends in the Chicago Metropolitan Area[10]. According to the US Census, Latinx/a/o people are now the second largest racial group in Chicago and the surrounding region.
This has naturally led to increases in Latinx/a/o students in regional public schools, and in particular, in Chicago Public Schools. Census data show that 85% of Latinx/a/o children in the city choose to enroll in public schools. As of the 2020 school year, Latinx/a/o students made up 47% of all students in Chicago Public Schools[11]. In 1970, when Latinx/a/os were only a small percentage of the overall population, these students were less than 10% of CPS enrollment.
Like Black families arriving in Chicago, the majority of Latinx/a/o families were coming for job opportunities. Chicago’s abundance of low-wage industrial jobs and easy access via train line made it a top destination for many Mexican families who had originally immigrated to the southern US. A large number of the earliest families to arrive before 1970 came through federal programs intending to address labor shortages in regional agriculture.
While Chicago’s residential segregation for newly arriving Mexican families was not as pronounced as it was for Black families, it was still present. Mexican families settled into communities near their jobs, which were mostly in low-pay industrial work such as steel mills, meatpacking, railroad work, and clothing manufacturing. Today the majority of Mexican residents, again by far the largest make-up of Chicago Latinx/a/o residents, still work in relatively low-wage construction, services, and manufacturing jobs.
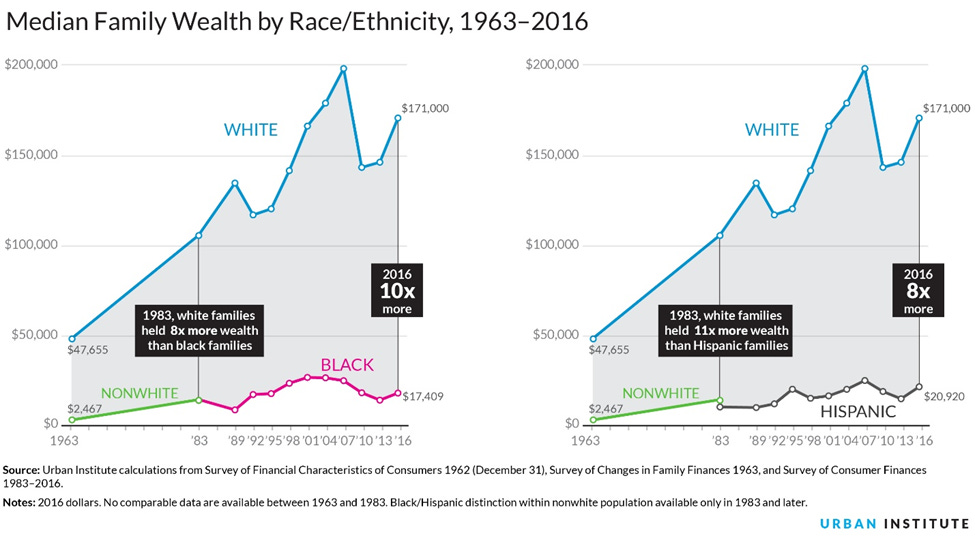
As a result, Latinx/a/o Chicagoans have substantially fewer resources than all other racial groups except Black Chicagoans. This aligns with national trends, where the median net worth of White households is eight times greater than the median net worth of Latinx/a/o households and ten times greater than the median net worth of Black households[12].
Thus, similar to Chicago’s Black students, the typical Latinx/a/o student in the region comes from a lower socioeconomic starting point than White students living in the region.
Academically, Chicago’s Latinx/a/o students perform on average slightly better than their Black peers, but below White and Asian students across metrics like graduation rates, college persistence, and reading and math attainment. The graduation rates chart we looked at in an earlier post is an illustration of this common trend in outcomes. The Achievement Gap is clearly still present for Latinx/a/o children.
Worth noting is how the charts for almost every academic metric have nearly identical racial stratifications as the economic data charts show for these racial groups. The correlation is obvious. The drivers for those economic are where we must have a deeper conversation, as it is here where discriminatory policy is creating the Achievement Gap we see for Chicago Black and Latinx/a/o students.
Asian Students in Chicago Public Schools
The fourth largest and fastest-growing racial group in the region is Asians. The City of Chicago’s Asian population grew by nearly a third from 2010 to 2020 according to the census and Asians are now more than 6% of the city’s residents.
Asian families in the city are also significant subscribers to the public school system, where 80% of their school-age children enroll. While we will spend most of our time discussing Black and Latinx/a/o families, it is important to spend a little bit of time unpacking the trajectory of Asians in our region.
The most important reason to discuss Asian students is that we sometimes encounter justification for a light-complexion to dark-complexion Achievement Gap by citing Asian performance as comparable to White performance, a topic we’ll detail in a future post.
Ok, now that we know who goes to school in Chicago and how the population came to look that way, let’s get into it.
Racist Explanations for Achievement
A common argument for the Achievement Gap has long been based on family structure and culture. Patrick Moynihan’s 1965 report The Negro Family: The Case for National Action created a narrative about the negative impact of the breakdown of Black family structure on Black student outcomes that is still prevalent today.
The report explicitly states that “the fundamental problem [for the Negro]. . . is that of family structure. The evidence — not final, but powerfully persuasive — is that the Negro family in the urban ghettos is crumbling.”
The report aimed to create a new national commitment to “the establishment of a stable Negro family structure.” Much of the narrative that follows in Moynihan’s report points to the correlation of struggles across various outcomes with higher rates of unmarried Black households and Black children born to unwed mothers. The report, which in 1965 was aiming to elevate the inequities that continued to exist for Black people even after the passing of the Civil Rights Act, posits that the issue ultimately lies with Black people rather than the context that they live in. Like the use of the term “Achievement Gap”, the report implies a genetic racial difference rather than assuming all humans are equivalent and their outcomes, therefore, have to be significantly influenced by the surrounding systems.
Ultimately, many of the arguments around “racial self-help,” “racial uplift,” and individual effort being the answer to improving Black academic and life outcomes were given a shot of adrenaline by the Moynihan Report that we still feel today. These ideas of Black and Latinx/a/o individuals with self-determination overcoming the difficult challenges of where they grew up are embedded in our cultural mainstream.
Movies like Dangerous Minds and Freedom Writers warm the hearts of audiences who are rooting for that clever, hardworking Black or Latinx/a/o student to beat the odds. These storylines emphasize individual effort but rarely spend much time showcasing the context around the protagonists other than as a set of obstacles that can be overcome by anyone with the grit and self-determination the heroes show.
They imply that everyone else around the heroes who do not “make it” are somehow flawed – that if those people had just also tried as hard as the central characters, they too would also “make it.” They reinforce this notion that being exceptional is what is required of Black and Latinx/a/o people if they want to “make it.”
We fail to tell the stories of the individual efforts of poor people, in particular poor Black and Latinx/a/o people, as they simply try to live their daily lives. We don’t credit the grit my brother showed when he was homeless and spent hours traversing the city searching for a warm meal and a bed for his family for the evening. We just blame him for being homeless.
We don’t credit the young woman whom I taught with grit when she decided to leave college to work two jobs in support of her younger siblings. She and her siblings didn’t live with their parents and putting food on the table was the responsibility of the oldest sisters, and now my student. Her logic makes sense, given the circumstances, but many of us just take a quick glance and see a college dropout.
There are millions of these examples of incredible grit and determination playing out every day in the Chicago region. Our biases and the myth that self-determination is somehow genetic and proven by our outcome data, and thus racial, prevent us from acknowledging these examples.
And because we aren’t willing or able to see how common grit and determination are in all people regardless of background, we have spent considerable energy elevating these ideas as central themes of what we must specifically educate Black and Latinx/a/o students on in order for them to succeed.
For instance, The Knowledge is Power Program - KIPP’s, a national network of college-preparatory charter public schools, had a slogan for decades that was Work Hard. Be Nice. Their schools serve predominantly poor Black and Latinx/a/o students across the country, and rich within their culture was the notion of teaching grit and resilience that implicitly originates from the idea of some having more of these attributes than others. Given who they were teaching, Black and Latinx/a/o students, this idea was also racialized. This notion of grit and determination deficits specifically in Black children was reinforced by the family structure theory that Moynihan’s famous report gave energy to. And while family culture and configuration for Whites is rarely mentioned, it is an ever-present, implicitly assumed model for optimal family structure, culture, and child-rearing.
Notably, Latinx/a/o family culture does not get as much emphasis because it undoes this argument. Latinx/a/o families actually have higher marriage rates than White people, as well as lower divorce rates[13]. According to the implications suggested by the Moynihan report, we should therefore anticipate Latinx/a/o students to be outperforming their White counterparts, which they are not. But instead of recognizing this contradiction, which invalidates the family structure arguments, we often see Latinx/a/o family structure left out of the discussion altogether.
What we overlook here is that arguments where one racial group is purported to have stronger familial and cultural foundations are problematic in their nature. They make vast generalizations of extremely diverse populations. They also presume a particular type of child-rearing and family arrangement is optimal.
Really, all these arguments achieve is to legitimize White achievement in an implicitly racist way. Superior culture arguments propping up Asian success build a narrative that the system is fair and thus implicitly rationalizes White success within the system. Inferior culture arguments about the broken Black family and the absent Black father as the root of the failings of Black people do the same. So does omitting the academic struggles we see for Latinx/a/o children, even though their family configurations would be deemed more favorable by this line of argument. As such, we have to realize in the end that culture and family structure arguments are a convenient way to keep the emphasis on race and individuals and avoid talking about racism and systemic barriers.
Don’t just take my word for it. We have an abundance of evidence demonstrating the errors embedded in these cultural arguments.
In 2018, the Director of the Harvard-based economic research non-profit Opportunity Insights, Raj Chetty, and colleagues Nathaniel Hendren, Maggie Jones, and Sonya Porter, released a study[14] investigating the role of familial structure on economic outcomes. Noting the “natural assumption that other unobserved factors that contribute positively to childhood development are positively correlated with marital status,” they found that “parental marital status plays a limited role in explaining intergenerational gaps,” in economic outcomes.
Opportunity Insights’ study narrows in on lifetime earnings, but we can use it to consider educational outcomes as well because lifetime earnings are highly correlated with education level. Research shows there are substantial differences in lifetime earnings depending on a person’s education level. According to data accumulated by the Social Security Administration of the United States, this holds true even when controlling for socioeconomic factors that influence earnings and the likelihood one will attain a college degree. Someone with a Bachelor’s Degree is likely to earn double in their lifetime what someone who does not finish high school will earn[15].
Given the correlation between economic outcomes and educational outcomes, it is logical to assume that any impact Opportunity Insights’ report found on economic outcomes due to familial structure would also likely show up in a study evaluating the impact on academic achievement. Controlling for family structure does have some impact, which common sense tells us it should. A single-parent household generally has less earning potential compared to a two-parent one, and we know resources influence academic outcomes. However, controlling for family structure does not eliminate the gaps between racial groups, as the cultural arguments might suggest, meaning there is something larger afoot[16].
This argument comes apart further when we simply take into account how many different cultures are captured within each of these racial categorizations. If spoken language can serve as a proxy for distinct culture, which we know is insufficient but likely the best shorthand metric available, then Asia as an example, has more than 2,300 different cultures alone. How realistic is it that our category of Asian can accurately represent a singular culture that is somehow genetically predisposed to do well academically?
The same is true for the White, Black, Latinx/a/o, and Native American racial/ethnic groups, the latter having 574 federally recognized tribes.[17] All of these represent thousands upon thousands of different cultures and family configurations. Not to mention how economic factors and other systems can adversely impact the potential for there to be two parents in a household, disrupting what might very well be a cultural norm for a group.
We have to consider conditions such as mass incarceration and poverty that create a higher likelihood of single-parent households before we blame a group of people for having too many single-parent households.
These households are a result of the conditions we have subjected the families to more than a result of some racial distinction in behavior. According to the census, before 1960 Black people married at a higher rate than White people. Attributing the struggles and/or “failures” of their children to their growing up in a single-parent environment ignores the context that manufactured more single-parent environments after 1960.
That said, it is not a foregone conclusion that children from single-parent households will fail or children from two-parent households will succeed. What is true is that two-parent households tend to have more resources to support their children. We know resources matter. To assume academic and life outcomes for people are a result of a particular family configuration without considering what creates that household, or even more ethnocentric, a result of a specific culture, is naïve at best and bigoted at worst.
The two-parent household I grew up in is only one small anecdotal sample in a vast ocean of samples. Yet, it provides an important lesson. My brother Shane and I had different outcomes. I know firsthand that the resources my parents were able to provide created abundant opportunities for all three of their boys. I also know that they didn’t have enough resources for us in every circumstance. We had some safety nets if you will, but not the kind that some of my White peers from Crown Point had and certainly not anywhere close to the kind my affluent peers I encountered in Williams had access to.
By comparison, and an irony that I have never forgotten, is that at nearly the same time my older brother’s addiction issues were coming to my parents’ attention, a fellow college student wrapped his jeep around a tree driving while intoxicated with my suitemates in the car with him. All of them fled the scene of the crash without serious injury, leaving the totaled vehicle. Of course, the police found the jeep and tracked down the plates. None of them got in trouble, as their parents and lawyers got involved. And the driver had a new jeep within weeks of the incident.
I still recall at that time, a freshman in college, wondering how consequences had missed them, how it was possible anyone could have enough wealth to just buy a new car for this kid, and why they would after what had just transpired. Maybe his parents were married? Maybe they weren’t? What mattered was not their “family structure” but their wealth, power, and influence.
[1] CPS Annual Regional Analysis - https://www.cps.edu/sites/ara/district-overview/
[2] Kids First Chicago. (2021). 2021 K1C Enrollment Report - Part 1 [PDF document]. Retrieved from https://static1.squarespace.com/static/5b212dce5417fcd9ddec5349/t/6228cb06d6517e03568b7bd5/1646840596978/2021-K1C-Enrollment+Report-PART+1-vFINAL.pdf
[3] US Census Data
[4] CPS Data Portal, Enrollment Data (2010-2011 school year)
[5] US Census Data
[6] US Census Data
[7] CPS Data Portal, Chicago Public Schools enrollment
[8] Chicago Metropolitan Agency for Planning (CMAP) - https://www.cmap.illinois.gov/updates/all/-/asset_publisher/UIMfSLnFfMB6/content/latino-population-growth-drives-metropolitan-chicago-s-population-growth
[9] The Economist. (2017, October 5). Latinos have become Chicago's second-largest ethnic group. Democracy in America. Retrieved from https://www.economist.com/democracy-in-america/2017/10/05/latinos-have-become-chicagos-second-largest-ethnic-group
[10] US Census Data
[11] CPS Data Portal, Chicago Public Schools enrollment
[12] Urban Institute calculations from Survey of Financial Characteristics of Consumers 1962 (December 31), Survey of Changes in Family Finances 1963, and Survey of Consumer Finances 1983–2016. Link: https://apps.urban.org/features/wealth-inequality-charts/index.html
[13] Mayol-García, Y., Gurrentz, B., & Kreider, R. M. (2021). Number, Timing, and Duration of Marriages and Divorces: 2016 (Current Population Reports, P70-167). U.S. Census Bureau. Retrieved from https://www.census.gov/content/dam/Census/library/publications/2021/demo/p70-167.pdf
[14] Chetty, R., Hendren, N., Jones, M. R., & Porter, S. R. (2018). Race and Economic Opportunity in the United States: An Intergenerational Perspective. Retrieved from http://www.equality-of-opportunity.org/assets/documents/race_paper.pdf
[15] Tamborini, Christopher R., ChangHwan Kim, and Arthur Sakamoto. 2015. “Education and Lifetime Earnings in the United States.” Demography 52: 1383–1407. Retrieved from https://www.ssa.gov/policy/docs/research-summaries/education-earnings.html
[16] Kuhfeld, Gershoff, E., & Paschall, K. (2018). The development of racial/ethnic and socioeconomic achievement gaps during the school years. Journal of Applied Developmental Psychology, 57, 62–73. https://doi.org/10.1016/j.appdev.2018.07.001
[17] Indian Entities Recognized by and Eligible To Receive Services From the United States Bureau of Indian Affairs (2021), Link: Federal and State Recognized Tribes